Net Promoter Score
- What exactly is the Net Promoter Score (NPS)?
- Why is it one of the most popular CX metrics?
- How is the NPS used correctly?

The NPS (abbreviation for Net Promoter Score®) is one of the most important key figures in Customer Experience Management (CXM). However, many companies give far too little thought to how to use the NPS correctly. Because despite all the advantages that the use of this metric can bring, it is neither a no-brainer nor a "one size fits all" KPI. In this article, we show you how to calculate and interpret the NPS. We also go into how you can escape the disadvantages of NPS and turn them into advantages.
The NPS is collected within the framework of a single question, which usually looks like this:
"How likely is it that you would recommend us to a friend/colleague?"
Instead of simply asking customers about their satisfaction, the NPS attempts to determine how likely it is that a company, its services or products will be recommended to others.
Usually, the NPS is determined by mail, in the app, or directly on the company's website. External satisfaction surveys are also a popular survey instrument.
In order to guarantee that impressions are still fresh, NPS surveys are often conducted directly after a customer interaction, such as a purchase, a delivery or a service phone call.
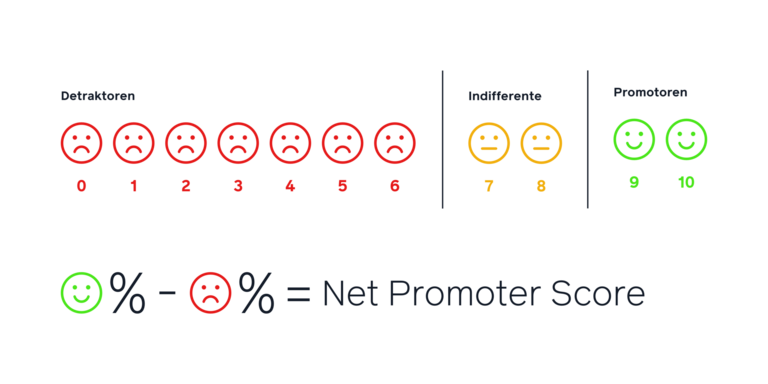
The calculation of the NPS is based on a scale of 0-10, within which the evaluation takes place.
Based on the answer, the respondents are divided into three different categories:

When calculating the NPS, the percentage of detractors and promoters is determined. The difference between these two values forms the NPS, represented in the following formula:
NPS = Proportion of promoters in % - Proportion of detractors in %.
The NPS value can therefore be between -100 and +100.
Customer Experience Management guarantees satisfied customers, reduces churn and ensures long-term business success.
Basically, the higher the NPS, the more respondents would recommend the company's products or services to others. For companies, this means: a positive NPS value is the minimum goal. And: the higher the value, the better.
If the NPS is negative, it means that there is a higher proportion of respondents who would not recommend the company. In such a case, there is an urgent need for improvement.
However, the concrete values at which one can speak of a good, great or simply average NPS vary from industry to industry.

A representative study by the University of Bamberg determined the average NPS values of large companies on the German market.
Even though this list is by no means exhaustive, it nevertheless gives an impression of the generally good comparability of the NPS between companies in the same industry.
Car brands in particular, for example, stood out with high NPS scores of 20-40.
It is interesting that none of the companies managed an NPS score of over 50, a value above which one would normally speak of a very good NPS. However, it is also true here that this benchmark should be regarded as a rule of thumb and, if necessary, adjusted in the context of one's own industry.

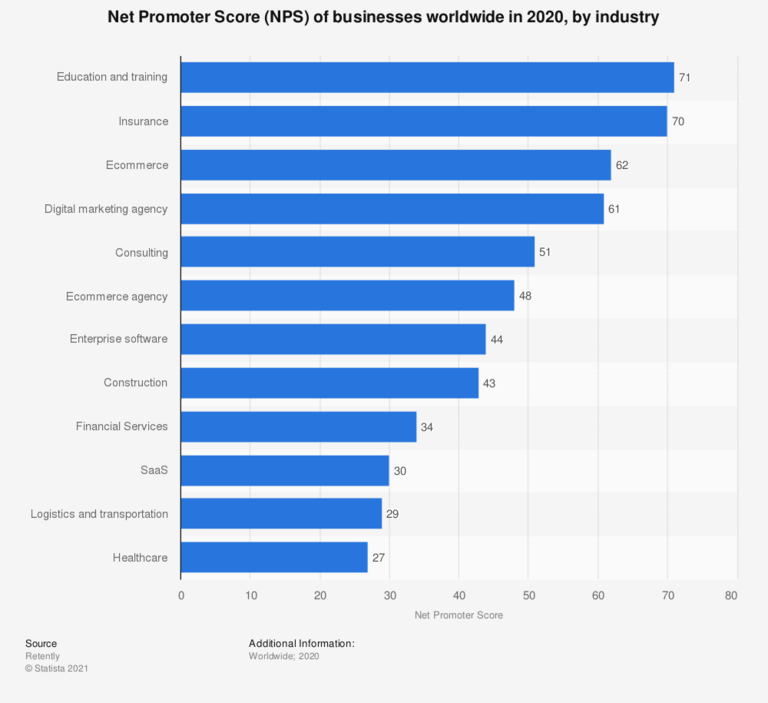
More up-to-date data, but not related to the German market, can be found at Statista:
However, this list is by no means exhaustive.
However, the partial discrepancy between the two sets of data makes it clear that comparative values should be continuously updated.
Tip: There are tools and databases on the web that allow a comparison of the NPS for numerous sectors.
Each of us has probably come across the NPS dozens of times in the wild - and not without reason. The NPS has established itself as the central customer satisfaction metric over the past almost 20 years primarily because its use brings with it many advantages.
The advantages of the NPS:
However, for all its advantages, the NPS is not without its shortcomings.
The disadvantages of the NPS... and their solution:
Above all, the low information density is a limitation of the usefulness of the NPS. This is because, considered on its own and without further information, it lacks a central piece of information that is crucial for successful customer experience management: the "why".
Why was a customer particularly satisfied? What was the decisive factor in their experience? On the other hand, what caused a customer to make a particularly bad statement? Is it just an isolated, one-off problem or does their rating indicate a deeper need for improvement?
One way to gather this information is to supplement the simple NPS question with a more comprehensive satisfaction survey that looks separately at different aspects of the customer experience.
A much more elegant solution is the simple extension of the NPS question by a text field in which the respondent can explain his or her choice of rating.
Customers are thus given the opportunity not only to express their level of satisfaction - or dissatisfaction - but also to tell the company why they arrived at their personal rating.
In the following section, we will look at how automatic and AI-supported text analysis can be used to keep the evaluation effort of such a survey approach as low as possible.
Automatic text analysis, also known as "text mining", is mostly used to find out two things about a text:
A text can be, for example, the open question mentioned above, which can be added to an NPS survey.
Sentiment analysis can be used to determine the "mood" of a text. As a rule, the comment as a whole or individual text modules within the comment are assigned the labels "positive", "negative" or "neutral".
The topic analysis assigns texts and text modules to a list of - usually predefined - topic categories. Based on keywords, the main topic, or a series of important topics, can be automatically identified within a text.
It becomes particularly interesting when these two methods of analysis are combined. This makes it possible to identify which topics elicit a positive reaction, which topics are praised and which are associated with negative experiences on the part of the respondents.

Let's assume a customer has given an NPS score of 7. This means they are neither a detractor nor a promoter, but are assigned to the category of indifferents. However, it is not clear what steps a company must now take to turn exactly these or comparable people into promoters.
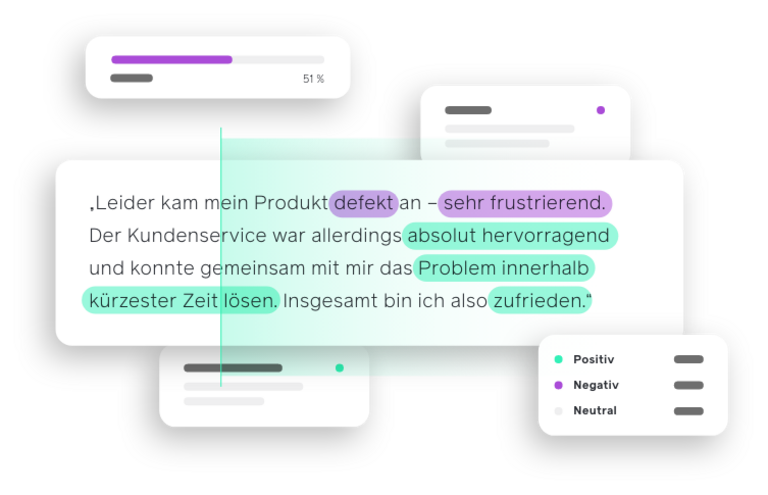
At least not as long as there is no option to justify the evaluation. This justification could look something like this:
A well-constructed text mining tool could not only extract three categories from this comment - product, service and overall satisfaction - but also link them directly to the sentiments expressed.
Based on this example, the CX managers of a company could derive several insights:
The company now knows what was missing from the customer's customer experience and can react by reviewing and improving quality assurance.
In the same way, the above evaluation could be taken as an opportunity to acknowledge the obviously well-oiled support team.
The NPS thus gets the missing context through the open text question.
If this process is now carried out for the thousands and tens of thousands of feedbacks that many companies collect, data can be obtained that is quantitatively robust but allows qualitative conclusions to be drawn.
The NPS measures the probability of a customer recommending a company to others and thus goes beyond the evaluation of customer satisfaction. The NPS is very easy to measure with a short survey about critical points of contact with the customer.
Due to its simplicity, however, the NPS also has disadvantages, first and foremost the low information density. Companies that survey the NPS without additional context often do not know what exactly led the respondents to their personal assessment.
The NPS alone is therefore primarily suitable for measuring the status quo and mapping changes over time. It can be used, for example, to check whether improvement measures have been successful.
Combining the NPS with an open text question significantly expands the amount of insights that can be gained from it. An automated text analysis tool helps to manage the analysis of the comments collected even with small teams.
This allows companies to benefit from qualitative feedback without having to spend additional capacity and costs on manual coding.
If companies react quickly to negative feedback from a customer and offer suggestions for solutions, the chances that the customer will even withdraw his or her criticism increase. A dissatisfied customer who feels treated with respect and, on top of that, has his or her problem solved, is often more satisfied after such contact than customers who had no problem at all.
moveXM offers companies of all sizes a quick and easy entry into CX management. With flexible scaling options, you unfold your full potential - at your own pace.
After just two hours of set-up and live onboarding, both you and moveXM are ready to create outstanding customer experiences. Within 15 minutes you can create questionnaires and collect customer feedback.
With intuitive dashboards, automatic text analysis and modern AI, moveXM generates insights for you. This helps you achieve more revenue and profitability with minimal effort.
With moveXM you no longer leave customer satisfaction to chance. Our software is certified for security and quality. Create excellent CX - with excellent software
Ensure more turnover and ROI now! Contact us and receive individual consultation.